I held Sera's listing notes back from Connect numbers. In the Glow Score post I said I did not have impression figures I trusted yet. On September 27 I did.
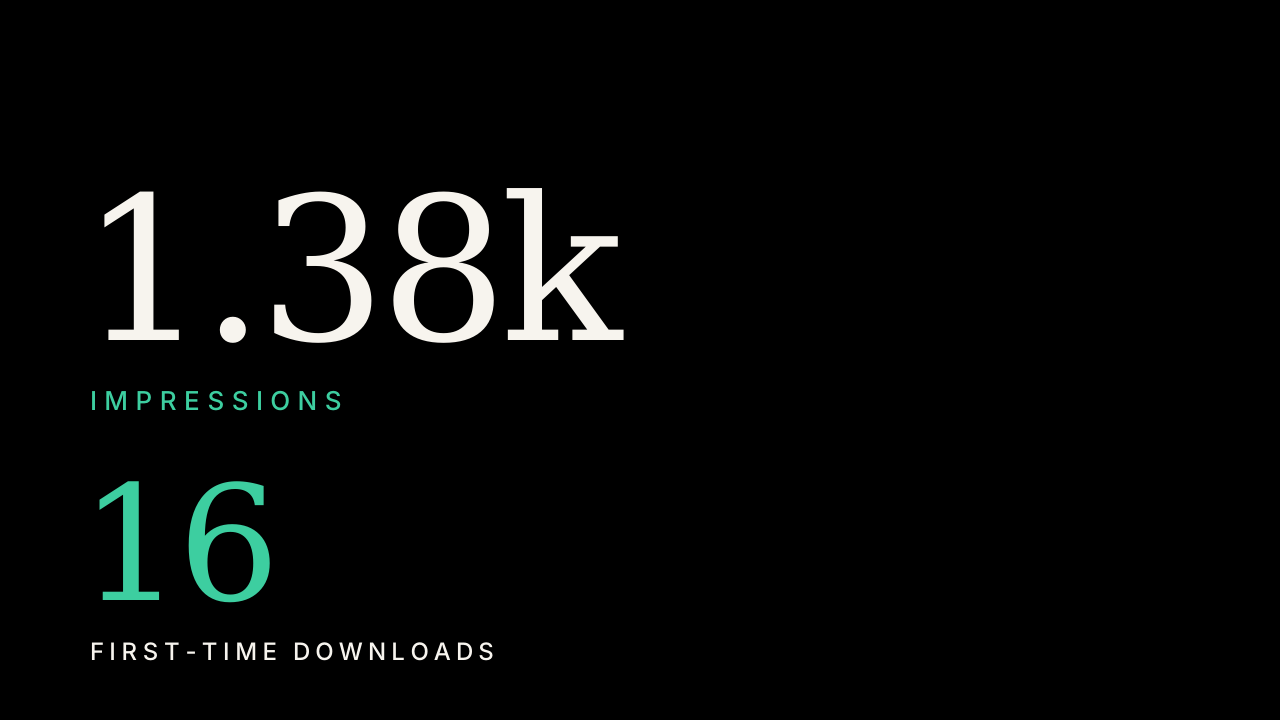
Sera: Skincare & Glow Score showed 1.38k impressions, 121 product page views, 16 first-time downloads, 2 redownloads, 9 updates, and a 1.83% conversion rate (daily average). Sales: $3 proceeds, 1 in-app purchase. Download-to-paid: 5.56% on day 1 and day 7, 9.09% on day 35.
Small n. I am writing them anyway, because hiding a small chart is how you keep pretending the listing is a theory.
Smallest store of the three, not the worst conversion
Hangar had more impressions. Monetra had more of everything. Sera's conversion on this overview is the highest of the three. That is not a win I am going to scale into a strategy. Sixteen first-time downloads is a start. It is not a category.
The useful split is still the same: 1.38k people saw the listing, 121 opened the page, 16 downloaded. If the first screenshot does not show a Glow Score, I already know what I would blame. I still cannot prove it from this dashboard.
One purchase is not a business
$3 and one in-app purchase means someone paid. Day-35 download-to-paid at 9.09% on this sample is one or two people, not a retention story. I will not turn that into a skincare-subscription narrative.
Sera is not a feed. I answered Apple's social media question honestly. The store job is still the score on screen, plus these numbers so I can tell when the listing is only impressions.